Licking County GIS Maps
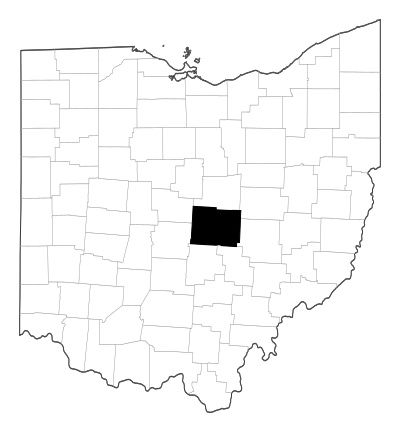
Licking County, Ohio, has 178,519 residents and covers 682.4 square miles. The population grew 7.2% between the 2010 and 2020 census. More residents moved in than left over that decade. The FIPS code for Licking County is 39089.
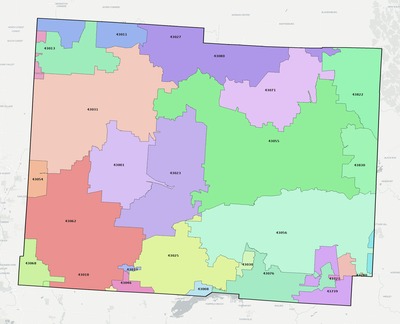
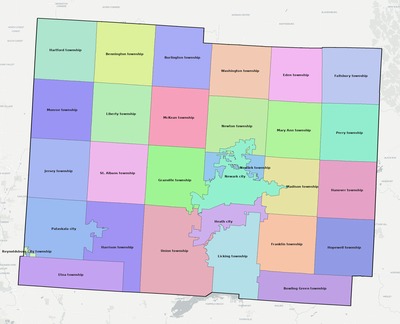
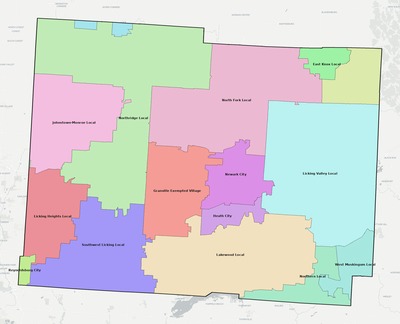
Newark is the county's largest population center. Licking County also includes 17 zip codes, 16 public school districts and 52 municipalities. Those boundaries help explain why population, schools, and housing can look different from one part of the county to another. The map below shows how those county lines, zip codes, and school districts fit together, and the sections that follow use that same geography to show population, demographics, school enrollment and housing patterns in more detail.
Maps, GIS layers and sample data. Paid packages add full layers, analytics and database files.
Licking County Trends
- Population
- 178,519▴
- Median Home Value
- $250,700▴
- K-12 Enrollment
- 42,433▾
County analytics dashboards with historical trends & projections included in package downloads.
Free starter access previews county maps, lightweight GIS, and sample data. Paid packages unlock full GIS layers, analytics, and database files.
Licking County Maps
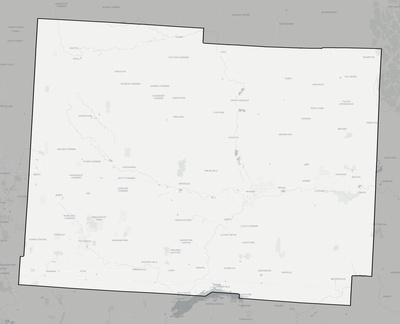
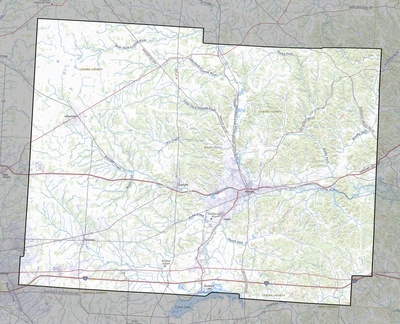
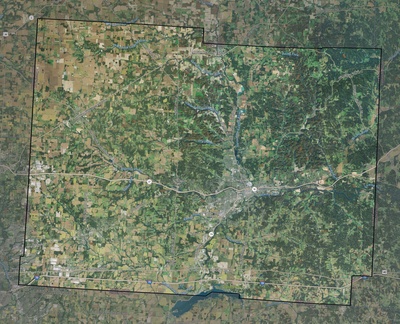
The maps below show a few of the county map styles included in our downloads. County packages include map exports in JPEG, PNG, SVG, PDF and GeoTIFF formats plus more than 20 GIS layers for mapping, research and analysis. Available layers include zip codes, area codes, subdivisions, school districts, political boundaries, roads, water features, points of interest and more.
County packages also include historical county demographics, business intelligence, analytical dashboards, AI-ready prompts, markdown files and related reference data. Everything is organized to save hours of manual work collecting current data, cleaning it and joining it together. That makes it easier to move faster on analytics, due diligence, business planning and location research. Paid packages are built for commercial use, but some package contents include source-specific attribution or notice guidance. Review Licensing & Data Source Notices.
Licking County Population
Licking County had 178,519 residents in 2020. That was 7.2% higher than in 2010. Licking County added 33,028 people between 2000 and 2020, which points to steady long-term growth. The county is fairly spread out, with about 262 people per square mile. Some of the county's most populated postal areas include Newark, Pataskala and Heath.
Population Trend in Licking County OH
Licking County Population per 2000, 2010 and 2020 census counts with a baseline 2030 projection.
Licking County Zip Codes
Licking County has 17 zip codes. Some of the county's most populated zip codes include Newark (43055), Pataskala (43062) and Heath (43056). Newark is the largest zip by population, with about 62,590 residents or 35% of the county total. Together, the three largest zips account for about 63% of all county residents based on 2020 population estimates.
Most Populated Zip Codes in Licking County OH
| ZIP | Area | Population | Trend |
|---|---|---|---|
| 43055 | Newark | 62,590 | ▴ 5% |
| 43062 | Pataskala | 32,125 | ▴ 16.2% |
| 43056 | Heath | 17,479 | ▴ 0.2% |
| 43023 | Granville | 14,462 | ▴ 9.3% |
| 43031 | Johnstown | 13,189 | ▴ 7.1% |
| Download all zip code data | |||
Licking County Zip Code populations and trends per most recent census data.
Licking County Demographics
Licking County has a median age of 40.2, which is close to the Ohio average. About 23% of residents are under 18, while 17.1% are 65 or older. That gives the county a fairly even mix of younger families and older adults. The largest age group is 25 to 44 at about 30.6% of the population, which points to a solid working-age base. About 29.3% of adults have a bachelor's degree or higher, above the statewide figure of 30.9%. The county is mostly White by population, though Hispanic, Asian, Black and multiracial residents are also part of the local mix.
Key Demographics for Licking County OH
Median Age
40.2
Under 18
23%
Age 65+
17.1%
Bachelor's+
29.3%
Licking County School Districts
Licking County is served by 16 public school districts with 42,433 students enrolled in 2024. The largest districts on the county map are Reynoldsburg City, Newark City and Licking Heights Local. Those three districts account for about 43% of public school enrollment in the map area. Total enrollment has stayed fairly steady in recent years, based on district totals from 2017 to 2024.
Largest School Districts by Enrollment in Licking County OH
| District | Enrollment | Share | Trend |
|---|---|---|---|
| Reynoldsburg City School District | 7,130 | 16.8% | ▾ -1.9% |
| Newark City School District | 5,789 | 13.6% | ▾ -0.7% |
| Licking Heights Local School District | 5,232 | 12.3% | ▴ 1.3% |
| Southwest Licking Local School District | 5,039 | 11.9% | ▴ 2.3% |
| Granville Exempted Village School District | 2,517 | 5.9% | ▾ -0.6% |
| Download all school district data | |||
Licking County school district enrollment and trends per most recent NCES reporting data.
Licking County Housing & Real Estate
Licking County has a median home value of $250,700 and a median gross rent of $999. About 74% of occupied homes in the county are owner-occupied, so the local housing market leans heavily toward ownership. Home values run above the Ohio median, while rents come in above the state average. In March 2026, the median listing price was $381,450 and homes spent about 44 days on the market.
Licking County Housing Mix
Licking County housing mix: owner, renter and vacant units.
Licking County Housing Trends
Licking County median home value and rent trend (last 5 years).
Businesses in Licking County, OH
Licking County has 6,332 business listings across 703 categories. The largest categories in Licking County business listings are Churches & Religious Organizations (206, 3.3%), Auto Repair (135, 2.1%), and Contractors (114, 1.8%). The full Licking County business listings dataset includes names, categories, addresses and contact details where available. Licking County packages also include U.S. Census County Business Patterns data with establishment counts, employment and payroll by industry sector.
Top Business Categories in Licking County, OH
| Category | Businesses | Share |
|---|---|---|
| Churches & Religious Organizations | 206 | 3.3% |
| Auto Repair | 135 | 2.1% |
| Contractors | 114 | 1.8% |
| Pizza Restaurants | 105 | 1.7% |
| Farm | 89 | 1.4% |
| Real Estate Agents | 84 | 1.3% |
| Gas Stations | 82 | 1.3% |
| Community & Nonprofits | 78 | 1.2% |
| Parks & Recreation | 76 | 1.2% |
| Insurance Agencies | 69 | 1.1% |
Licking County Business Listings
| Business | Category | City |
|---|---|---|
| Altercare Newark South | Abuse And Addiction Treatment | Newark |
| Bookstore (Denison University) | Academic Bookstore | Granville |
| Summerhouse Square Apartments | Accommodation | Newark |
| V L James Accounting | Accountant | Newark |
| Denison Golf Club | Active Life | Granville |
| Red Pony Medicine Acupuncture | Acupuncture | Newark |
| Lion's Den | Adult Entertainment | Heath |
| Kennedy Outdoor Advertising | Advertising Agency | St Louisville |
| FHC Distributing | Agricultural Cooperatives | Frazeysburg |
| Ohio Seed Improvement Association | Agricultural Service | Croton |
| Download Licking County business listings | ||
Licking County business listings sourced from Overture Maps. Includes locations with a high level of confidence.
Licking County Basemaps
Licking County map and data packages include a set of useful basemaps to help you get started quickly. These include a custom light grey canvas, USGS topo, imagery and other reference layers that make it easier to build clear, meaningful county maps using the included GIS layers, your own data or both. Pre-rendered map tiles for the light grey basemap are included so you can use them offline or host them on your own CDN.
Get the Full Licking County Data Package
This page shows a preview of what's included in the Licking County data package. The full package gives you a ready-to-use county data system with GIS layers, historical data, maps, database files and planning tools that save hours of manual data gathering, cleanup and joins. Everything is organized to help you skip data wrangling and start analysis faster.
- 20+ GIS layers for zip codes, school districts, roads, water, boundaries and more
- Historical county demographics, housing, income and trend data
- ZIP code population files and school district enrollment history
- Database files, markdowns, AI-ready prompts and documentation
- Map exports in PNG, JPEG, PDF, SVG and GeoTIFF formats
- Offline-ready data explorer, map and analytics tools
Paid packages support commercial use, client work, and derived outputs. Some package contents may include source-specific attribution or provider notices. See Licensing & Data Source Notices.
One-time · instant download · 30-day refund guarantee · See full package details
Preview a Live Package Demo
See exactly what is included in a county data package. Inspect how files are organized, the interactive data explorer and how maps and analytics are laid out. The demo loads a real sample package from Ohio — explore the full structure before you buy.
No email or download required. Opens in a preview window on this page.
Nearby Counties
Browse county data pages for the counties that border Licking County. These nearby pages include the same mix of county maps, demographic summaries, school district context, housing trends and package links.